CyberArk PAM environments are built on top of one of the most secure enterprise vault technologies in the cybersecurity industry – the CyberArk Digital Vault. Whether you are working on CyberArk implementation, administration, troubleshooting, cluster environments, DR setup, or Privilege Cloud integrations, understanding the internal architecture of the Vault server and PrivateArk Client is extremely important.
In real-world CyberArk projects, many engineers focus only on PVWA, CPM, and PSM components. However, the actual core of the CyberArk environment is the Digital Vault. Without understanding the Vault internals, troubleshooting production issues, DR failovers, cluster synchronization, remote administration, logging, or recovery operations becomes extremely difficult.
If you are new to CyberArk, you can first read our detailed beginner guide here:
CyberArk Tutorial for beginners - Step by Step Guide
You can also explore the overall Vault architecture in detail here:
In this article, we will deeply explore:
■ CyberArk Vault server components
■ PrivateArk Server process
■ PVWA Vault Logic Container
■ PrivateArk Client architecture
■ CyberArk log files and troubleshooting
■ Vault server keys and recovery mechanisms
■ Remote administration using PARClient
■ Workspace functionality
■ Server configuration files
■ Vault startup and shutdown operations
■ CyberArk Vault monitoring
■ Best practices for production environments
■ Cluster and DR considerations
This article is especially useful for:
■ CyberArk Administrators
■ CyberArk Engineers
■ PAM Consultants
■ Security Engineers
■ SOC Teams
■ CyberArk L2/L3 Support Teams
■ Students preparing for CyberArk certifications
■ Engineers working on CyberArk Vault clusters and DR environments
The CyberArk Vault is the heart of the entire PAM infrastructure. Every password, session metadata, platform configuration, account object, and audit activity eventually communicates with the Vault.
The Vault is designed with military-grade security principles and provides:
■ Encrypted storage
■ Secure communication
■ Tamper-resistant architecture
■ Isolated operating environment
■ High availability
■ Disaster recovery support
■ Secure key management
■ Advanced auditing and logging
If you want to understand how CyberArk Vault clusters operate in production environments, read this complete guide:
Learn about CyberArk Digital Vault Cluster Environment
For distributed Vault environments:
CyberArk Distributed Vault Environment
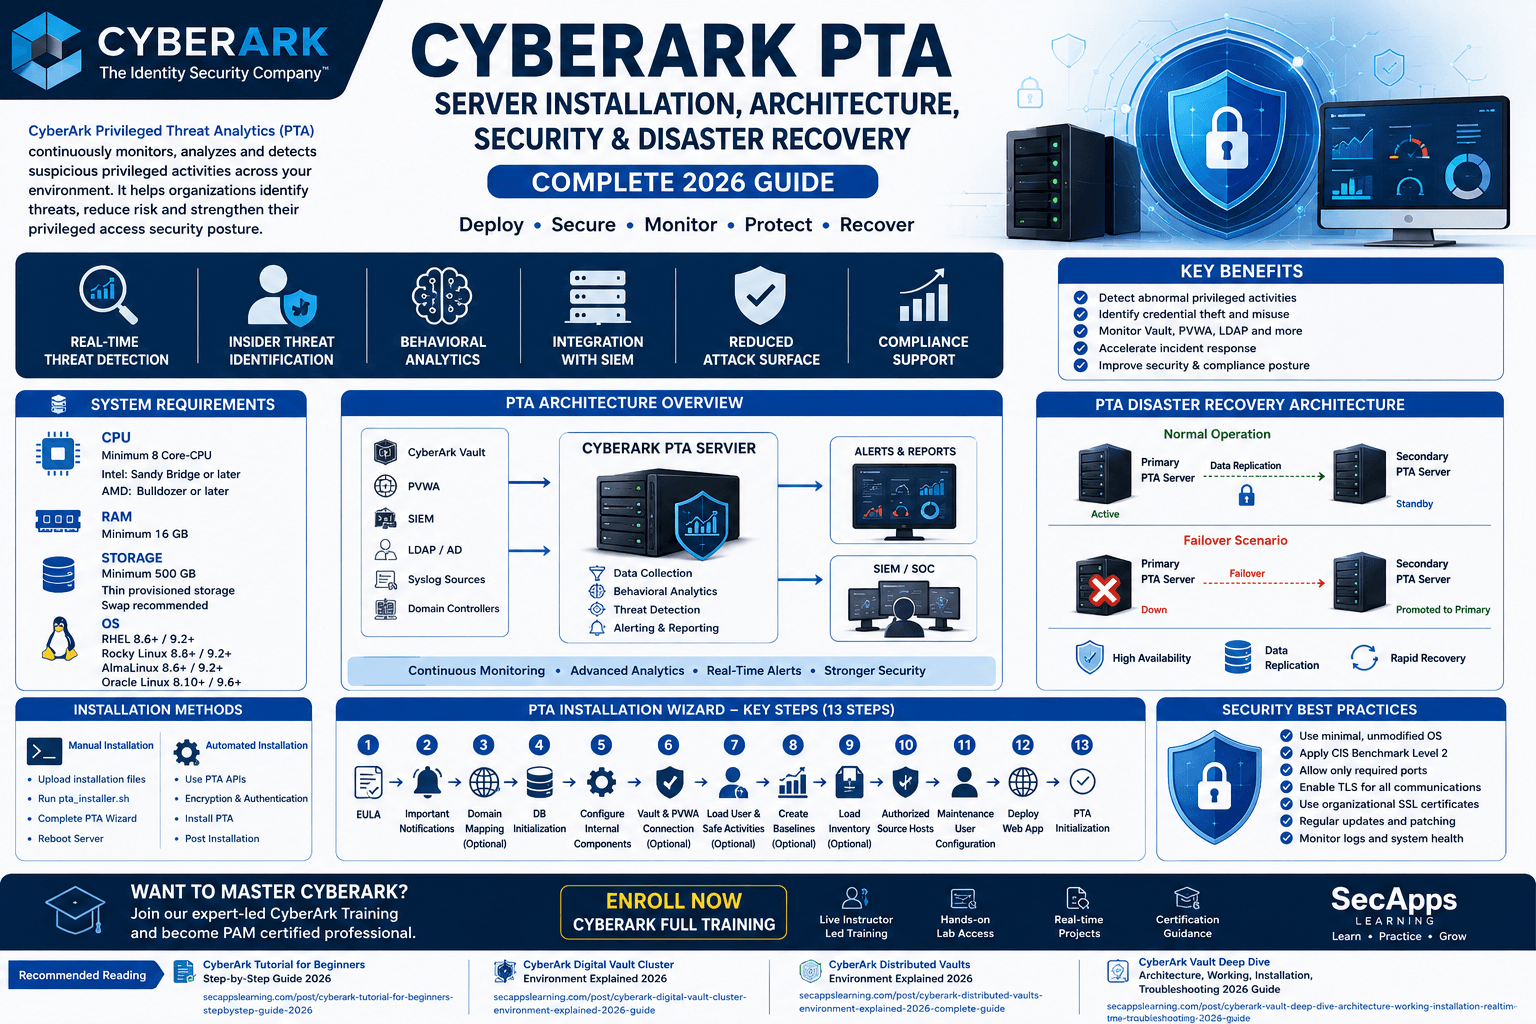
For DR architecture:
CyberArk Primary DR Vault Environment
The CyberArk Vault environment contains multiple internal components responsible for database operations, authentication, communication, logging, file handling, and administration.
Let us understand each major component in detail.
The PrivateArk Server process is the core engine of the CyberArk Vault.
The executable responsible for running the Vault service is:
■ Dbmain.exe
This service operates as a Windows Service and manages:
■ Vault database operations
■ Safe communication
■ Authentication requests
■ Password object handling
■ Session processing
■ API request handling
■ Vault replication
■ Audit logging
■ Encryption activities
The service can be configured to:
■ Start automatically
■ Start manually
■ Run in console mode
Running the service in console mode is mostly used during:
■ Troubleshooting
■ Vault recovery
■ Debugging startup failures
■ Parameter validation
■ Migration activities
Command used:
■ dbmain.exe console db
In production environments, the service generally runs automatically.
The Server GUI is the administrative interface used to manage the Vault locally.
Using the Server GUI, administrators can:
■ Start the Vault
■ Stop the Vault
■ View ITALog.log
■ Manage Safe storage paths
■ Review server activities
■ Perform troubleshooting
■ Manage operational tasks
The GUI is accessible using:
■ PrivateArk Server desktop shortcut
One important point:
The Server GUI can only be installed on the Vault Server itself.
This is done intentionally to maintain strict security controls.
One of the most important modern CyberArk Vault components is the Logic Container.
The Logic Container is responsible for handling:
■ Business logic execution
■ API request processing
■ PVWA interaction with the Vault
■ Database read/write operations
■ REST API transaction handling
■ Workflow execution
Whenever a request is initiated from:
■ PVWA
■ REST APIs
■ Scripts
■ Automation tools
■ Third-party integrations
The request passes through the Logic Container.
This makes the Logic Container extremely important during:
■ Troubleshooting API failures
■ PVWA issue analysis
■ Performance troubleshooting
■ Correlation ID tracing
■ Workflow debugging
The Logic Container maintains a dedicated log file:
■ BLServiceApp.log
This log is one of the most useful troubleshooting files in modern CyberArk environments.
The log contains:
■ API execution details
■ Request correlation IDs
■ Thread information
■ User details
■ Exception messages
■ Workflow execution records
■ Performance traces
Default log path:
■ $InstallationDirectory$\Logs
The location can be changed using:
■ LogFolder parameter in BLServiceApp.exe.config
Correlation IDs are extremely important during production troubleshooting.
Every request handled by the Logic Container gets a unique GUID-based Correlation ID.
This enables engineers to:
■ Track requests end-to-end
■ Correlate PVWA and Vault logs
■ Identify failed workflows
■ Analyze API failures
■ Troubleshoot integrations
■ Debug account onboarding failures
Example log format:
Example:
2021-05-23 21:49:28,448 INFO [7] AdminUser2 86edf03f-f11d-4d9f-8d21-8ee3a167b574 RunService | Logic container finished running service GetAllActivePlatforms from suite PIM
This becomes highly useful in large enterprise environments where thousands of requests are processed every hour.
CyberArk automatically rotates the BLServiceApp.log file.
By default:
■ Maximum size = 200 MB
When the size threshold is reached:
■ Current log is archived
■ New log file is created
Archived naming convention:
■ Arc-{yyyyMMdd-HHmmss}.LC.log
This helps avoid:
■ Massive log file growth
■ Disk space issues
■ Performance degradation
CyberArk Logic Container supports queued logging.
When enabled:
■ Logs are temporarily queued
■ Entire request context is flushed together
■ Logs are written only when required
Benefits:
■ Better troubleshooting
■ Improved request tracing
■ Reduced unnecessary logging
■ Improved performance
Important parameters:
■ QueueLogs=True
■ DebugLevel
■ MinSeverityToFlush
Debug levels:
■ None
■ Low
■ High
■ Profiling
The Vault server contains several critical files.
Default installation paths:
■ \Program Files\PrivateArk\Server
■ \Program Files\PrivateArk\Client
Registry path:
■ HKLM\Software\CyberArk\PrivateArk\Server
Important configuration files include:
DBParm.ini
This is one of the most critical CyberArk configuration files.
It contains:
■ Database parameters
■ Vault operational settings
■ Timeout configurations
■ Debug settings
■ Network parameters
■ Server key paths
■ Logging parameters
TSParm.ini
Contains:
■ Safe storage paths
■ Directory definitions
■ Safe allocation information
PassParm.ini
Defines:
■ Password policies
■ Complexity rules
■ Password expiration settings
■ Password history rules
License.xml
Contains:
■ CyberArk licensing information
■ Feature enablement
■ Customer licensing data
ExtAuth.ini
Used for:
■ LDAP integrations
■ External authentication
■ Directory services
■ Authentication mappings
ITALog.log is the primary Vault operational log.
This file contains:
■ Vault startup logs
■ Authentication activities
■ Replication activities
■ Communication failures
■ System events
■ Operational warnings
■ Critical failures
This is one of the first files checked during troubleshooting.
The log retention duration is controlled using:
■ LogRetention parameter in DBParm.ini
Debug.log is used for detailed troubleshooting.
It is controlled using:
■ Debug parameter in DBParm.ini
When enabled:
■ Additional debug records are generated
■ Detailed internal activities are logged
■ Advanced troubleshooting becomes easier
However:
■ It may increase disk usage
■ It may impact performance
■ Should be enabled carefully in production
CyberArk Vault security heavily depends on server keys.
There are two primary keys:
■ Server Key
■ Recovery Key
These keys are critical for:
■ Vault startup
■ Data decryption
■ Recovery operations
■ Master user access
The Server Key acts like the physical key of a bank vault.
Without the Server Key:
■ The Vault cannot start
■ Data remains inaccessible
■ Safe contents cannot be decrypted
The path is defined in:
■ DBParm.ini
Best practice:
■ Store the key on removable media
■ Keep it in a secure physical location
■ Avoid permanent storage unless automation requires it
The Recovery Key is used during disaster scenarios.
It supports:
■ Vault recovery
■ Master user access
■ Data restoration
■ Safe recovery
The Recovery Key consists of:
■ Public recovery key
■ Private recovery key
The private recovery key is extremely sensitive and must be protected carefully.
CyberArk Vault package contains:
Operator Folder
Contains:
■ Server key
■ Public recovery key
Used for:
■ Vault operations
■ Server startup
Master Folder
Contains:
■ Server key
■ Public recovery key
■ Private recovery key
Used for:
■ Recovery operations
■ Master authentication
■ Disaster recovery
CyberArk uses a staging area folder to temporarily store files during transfer.
Whenever users:
■ Retrieve files
■ Upload files
■ Modify objects
The files temporarily exist in the staging area.
Important security features:
■ Files are encrypted
■ Temporary traces are cleaned automatically
■ Transfer operations are secured
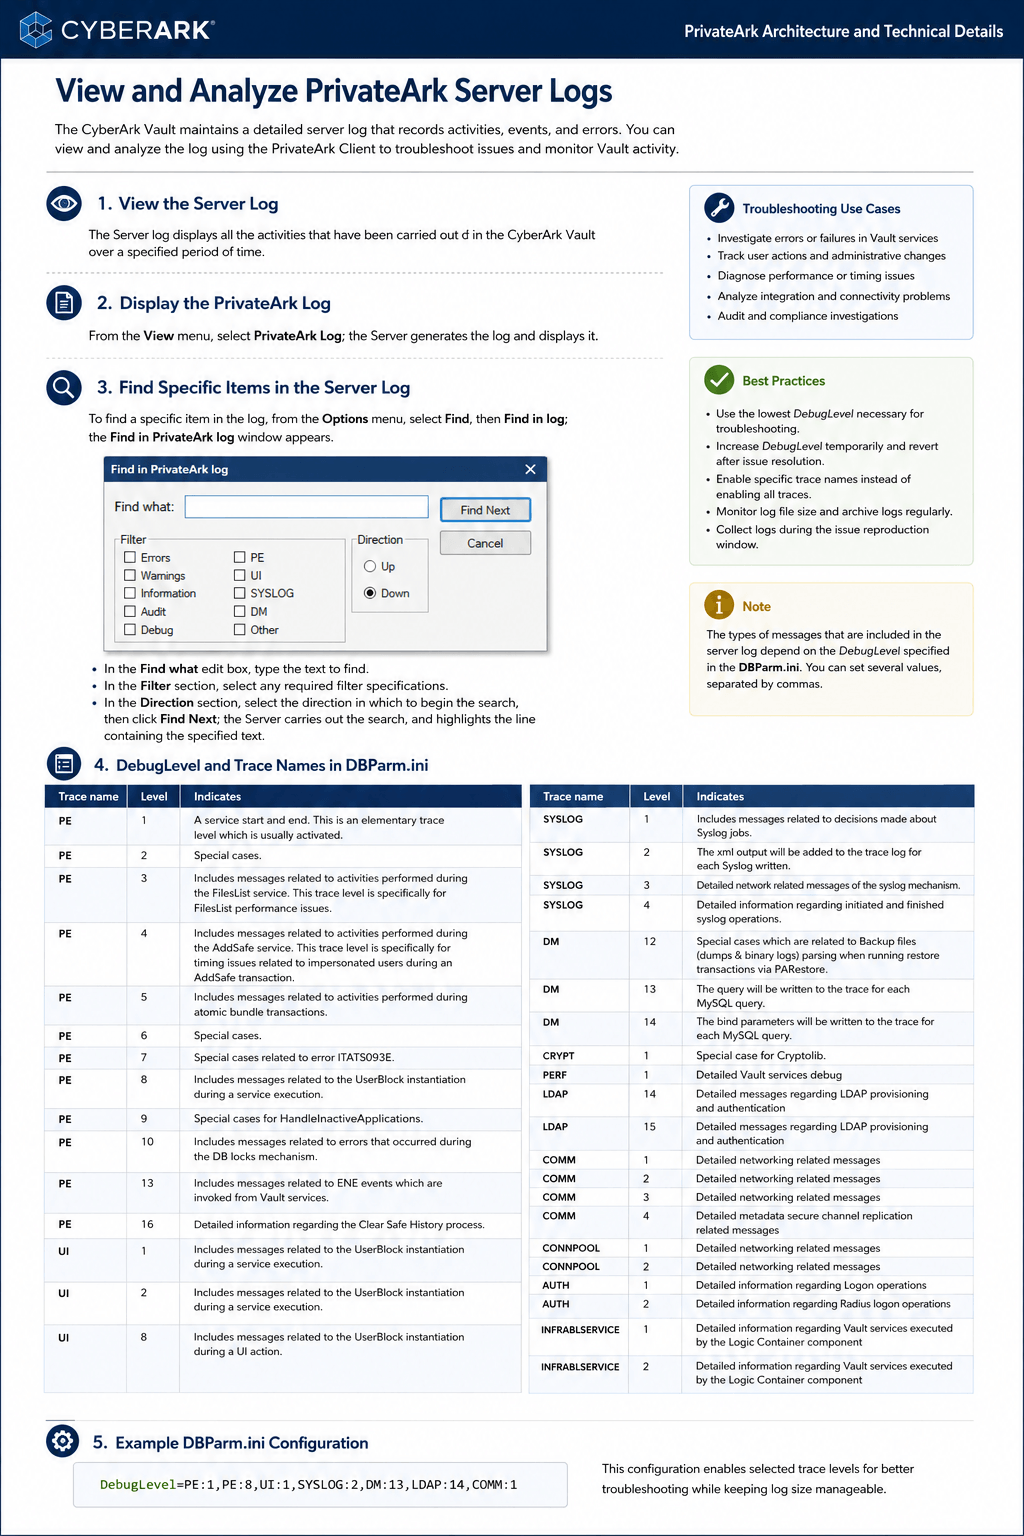
The Server log displays all activities carried out within the CyberArk Vault over a specified period of time.
The Server log is one of the most important troubleshooting and auditing resources in the CyberArk environment.
Administrators and CyberArk engineers use the Server log for:
■ Troubleshooting production issues
■ Investigating authentication failures
■ Analyzing Vault communication
■ Reviewing Safe operations
■ Tracking API requests
■ Monitoring replication activities
■ Auditing administrative actions
■ Diagnosing performance issues
To display the PrivateArk Server log:
■ Open the Server Interface
■ Go to the View menu
■ Select PrivateArk Log
The Server generates and displays the log entries.
The current operational logs are automatically shown in the administration interface.
Historical records can also be reviewed for advanced troubleshooting and audit investigations.
In large enterprise environments, the Server log can contain thousands or even millions of records.
CyberArk provides a built-in search mechanism to quickly locate specific activities.
To search inside the PrivateArk log:
■ Open the Options menu
■ Select Find
■ Choose Find in log
The “Find in PrivateArk Log” window appears.
Administrators can:
■ Search for text strings
■ Filter log entries
■ Search by direction
■ Locate specific service executions
■ Identify failures quickly
This becomes extremely useful while troubleshooting:
■ Authentication failures
■ Replication issues
■ Safe access problems
■ API transaction failures
■ Performance bottlenecks
■ LDAP issues
■ Syslog forwarding issues
■ Logic Container execution failures
The amount of information written into the Server log depends on the DebugLevel parameter configured in:
■ DBParm.ini
Multiple debug levels can be configured simultaneously using comma-separated values.
Choosing the correct debug level is extremely important because:
■ Lower levels provide basic operational logs
■ Higher levels provide detailed troubleshooting information
■ Excessive logging may impact performance and disk usage
In production environments, debug logging should always be carefully controlled.
PE Trace Levels
PE traces are commonly related to core Vault services.
PE 1
■ Logs service start and end events
■ Basic operational tracing
■ Commonly enabled in production
PE 2
■ Special-case operational messages
PE 3
■ Detailed FilesList service activity
■ Useful for FilesList performance troubleshooting
PE 4
■ AddSafe transaction timing analysis
■ Useful for impersonation-related troubleshooting
PE 5
■ Atomic bundle transaction tracing
PE 6
■ Special-case debugging scenarios
PE 7
■ Special cases related to ITATS093E errors
PE 8
■ UserBlock instantiation during service execution
PE 9
■ HandleInactiveApplications troubleshooting
PE 10
■ Database lock mechanism troubleshooting
PE 13
■ ENE event execution details
PE 16
■ Clear Safe History detailed tracing
UI traces provide information related to user interface activities.
UI 1 and UI 2
■ UserBlock instantiation during service execution
UI 8
■ Detailed UI action tracing
These traces are useful when integrating CyberArk with SIEM platforms.
SYSLOG 1
■ Syslog job decision processing
SYSLOG 2
■ Displays XML output of syslog entries
SYSLOG 3
■ Detailed networking activity for syslog mechanisms
SYSLOG 4
■ Detailed syslog operation lifecycle tracing
DM traces are primarily related to backup and restore operations.
DM 12
■ Backup file parsing details during PARestore operations
DM 13
■ MySQL query tracing
DM 14
■ MySQL bind parameter tracing
CRYPT 1
■ Detailed CryptoLib tracing
PERF 1
■ Detailed Vault service performance debugging
LDAP 14 and LDAP 15
■ Detailed LDAP provisioning logs
■ LDAP authentication troubleshooting
COMM 1–4
■ Detailed network communication logs
■ Secure channel replication tracing
CONNPOOL 1–2
■ Connection pool troubleshooting
AUTH 1
■ Detailed logon operation tracing
AUTH 2
■ Detailed Radius authentication tracing
INFRABLSERVICE 1–2
■ Detailed Logic Container service execution logs
■ Vault service execution troubleshooting
While debug levels are extremely useful during troubleshooting, enabling excessive debugging permanently in production environments is not recommended.
Best practices include:
■ Enable high debug levels only temporarily
■ Monitor disk usage regularly
■ Archive logs safely
■ Use correlation IDs for tracing
■ Disable unnecessary debug traces after troubleshooting
■ Maintain proper log retention policies
Enterprise environments processing large volumes of requests can generate extremely large log files when advanced debugging is enabled.
Therefore, proper monitoring and log management are critical.
The PrivateArk Client is the traditional Windows interface for interacting with the Vault.
Major components include:
■ Arkui.exe
■ Safeview.dll
■ PALink.exe
■ Office Extensions
Arkui.exe handles:
■ Client interface
■ Vault communication
■ Safe access
■ Alert display
■ Workspace operations
It acts as the primary interface between users and the Vault.
Safeview.dll integrates the Vault with the Windows filesystem.
This enables users to:
■ Open files directly
■ Save files transparently
■ Work with Safe contents like local folders
This creates the PrivateArk Workspace experience.
The Workspace is a temporary local storage area.
When users retrieve files from Safes:
■ Files are downloaded locally
■ Users modify them
■ Changes are synchronized back
Default location:
■ Under user profile directory
Important workspace files:
■ Desktop.ini
■ Paws.ini
■ Folders.ini
Benefits:
■ Transparent user experience
■ Secure file synchronization
■ Offline editing capability
■ Automatic Safe integration
The Client uses multiple registry paths:
■ HKLM\SOFTWARE\CyberArk\PrivateArk\ConfigInfo
■ HKLM\SOFTWARE\CyberArk\PrivateArk\Client
■ HKCU\SOFTWARE\CyberArk\PrivateArk\Client
Configuration file:
■ Arkui.ini
These control:
■ Client settings
■ Global configuration
■ User preferences
■ Vault connectivity
CyberArk supports centralized client configuration.
This allows administrators to:
■ Maintain consistent settings
■ Control enterprise-wide configuration
■ Deploy standardized parameters
■ Simplify administration
Utility used:
■ PAConfig
Example:
■ PAConfig /inifile Z:\PrivateArk\GlobalSettings.ini
The Server Interface allows administrators to:
■ Start Vault
■ Stop Vault
■ View logs
■ Manage configuration
■ Perform maintenance
Vault shutdown modes:
Normal Shutdown
■ Waits for active tasks
■ Safely completes operations
Immediate Shutdown
■ Forces active tasks to stop quickly
Terminate Shutdown
■ Immediately terminates operations
■ Used only in emergency situations
CyberArk provides remote administration capabilities using:
■ PARAgent
■ PARClient
This enables remote operational control of:
■ Vault
■ PADR
■ ENE
■ CVM
The Remote Control Agent runs on:
■ Vault Server
■ DR Server
Important configuration parameters:
■ RemoteStationIPAddress
■ RemoteAdminPort
■ ExtensionComponentList
■ UserCredentialsPath
Default port:
■ 9022
Password creation command:
■ Paragent setpassword
PARClient is a command-line utility used to remotely manage Vault environments.
Example command:
■ parclient 1.1.1.250/Asdf1234 /c "status vault"
Using PARClient, administrators can:
■ Start Vault
■ Stop Vault
■ Restart services
■ View logs
■ Retrieve CPU usage
■ Monitor disk space
■ Monitor services
■ Change parameters remotely
■ Retrieve event logs
Start Vault
■ start vault
Stop Vault
■ stop vault
Restart Vault
■ restart vault
Check Status
■ status vault
Get CPU Usage
■ getcpu
Get Disk Usage
■ getdiskusage
Retrieve Logs
■ getlog vault
Set Parameter
■ SetParm Vault DefaultTimeout=30 /Immediate
When building a CyberArk cluster:
■ Ensure synchronized configuration
■ Validate shared storage access
■ Verify cluster communication
■ Monitor replication health
■ Validate CVM operations
■ Monitor Vault logs continuously
A detailed cluster implementation guide is available here:
CyberArk Vault Deep Dive – Architecture, Installation & Troubleshooting 2026 Guide
Secure the Server Keys
■ Store keys securely
■ Use removable media when possible
■ Restrict access strictly
Monitor Logs Regularly
■ Review ITALog.log
■ Monitor BLServiceApp.log
■ Track correlation IDs
■ Audit failed requests
Maintain Proper Backups
■ Backup Vault safely
■ Protect recovery keys
■ Test recovery procedures
Use Remote Administration Carefully
■ Restrict PARClient access
■ Use strong passwords
■ Whitelist IPs carefully
■ Monitor administrative actions
Control Debug Logging
■ Avoid excessive debug logging
■ Enable only during troubleshooting
■ Monitor disk space usage
CyberArk engineers frequently troubleshoot:
■ Vault startup failures
■ Server key issues
■ Replication failures
■ Logic container failures
■ PVWA communication problems
■ API request failures
■ DR synchronization issues
■ Workspace synchronization problems
■ Cluster failover issues
■ Vault performance bottlenecks
Most troubleshooting activities involve:
■ ITALog.log
■ BLServiceApp.log
■ Debug.log
■ Windows Event Viewer
■ PARClient monitoring
Many engineers learn CyberArk only from the UI perspective.
However, real enterprise troubleshooting requires:
■ Understanding DBParm.ini
■ Understanding Vault startup process
■ Knowledge of keys and recovery
■ Understanding logging mechanisms
■ Understanding replication
■ Understanding Logic Container architecture
■ Understanding workspace operations
■ Understanding remote administration
This knowledge becomes critical during:
■ Production outages
■ DR failovers
■ Cluster migrations
■ Vault upgrades
■ Performance troubleshooting
■ Security investigations
If you want to learn CyberArk implementation, administration, troubleshooting, DR setup, Vault clustering, PSM, CPM plugins, REST APIs, automation, and real-time troubleshooting with practical labs, join our complete CyberArk training.
CyberArk Full Training – SecApps Learning
Training includes:
■ CyberArk Installation
■ Vault Setup
■ Cluster Environment
■ DR Environment
■ PVWA Configuration
■ CPM Configuration
■ PSM Configuration
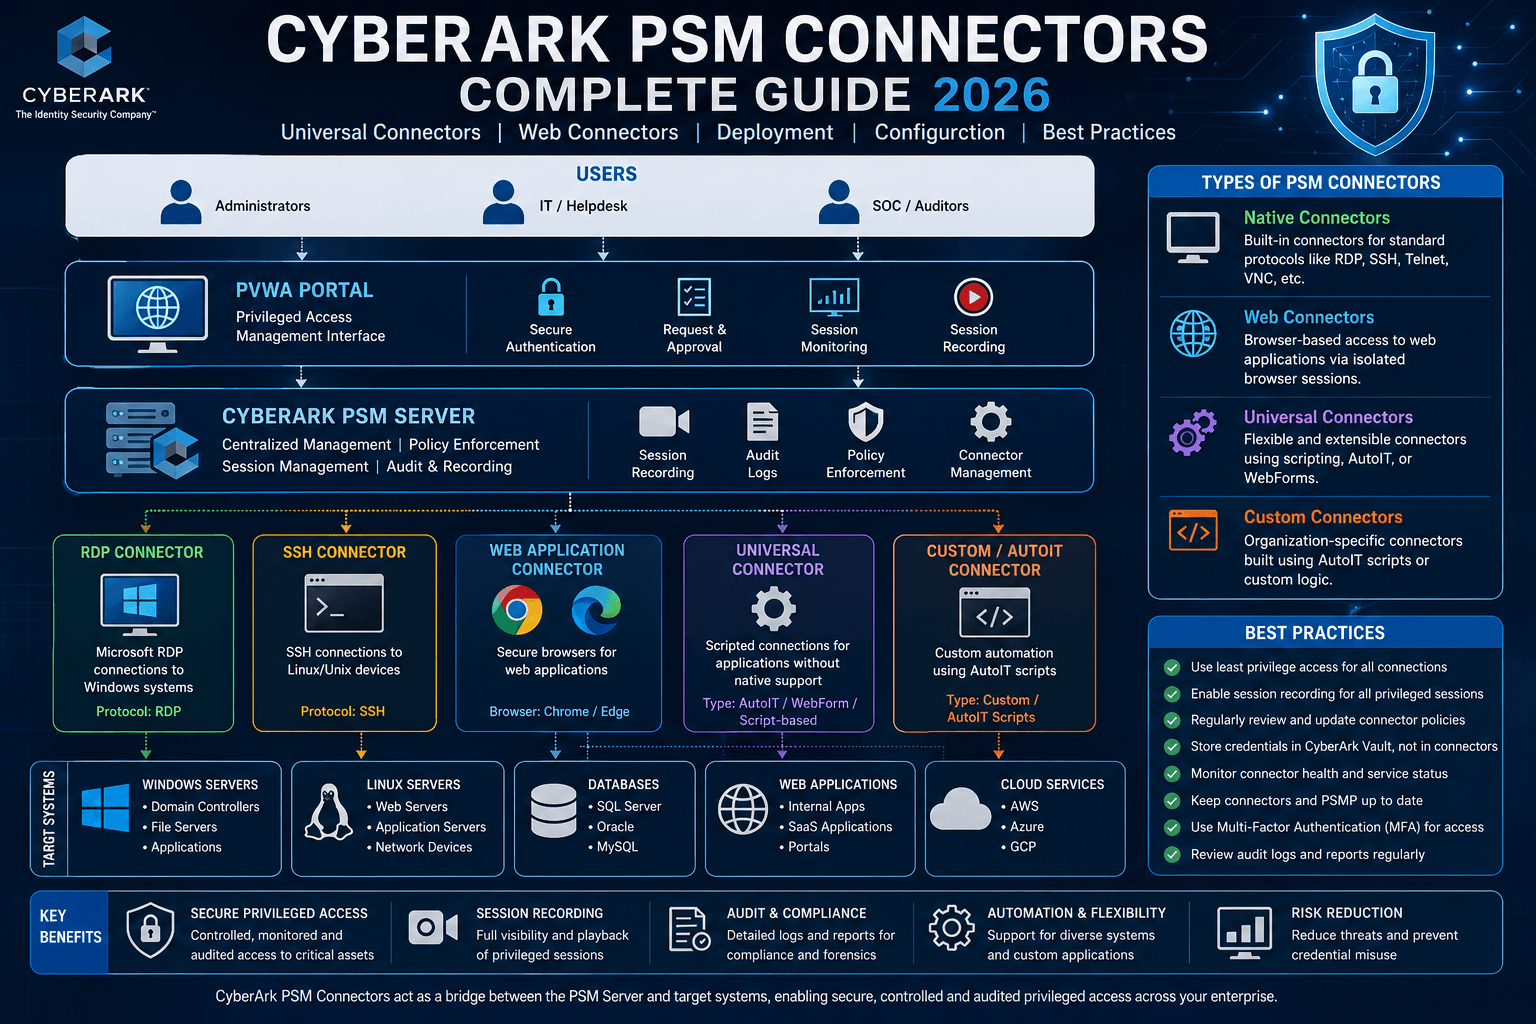
■ PSM Connectors
■ AutoIT Connectors
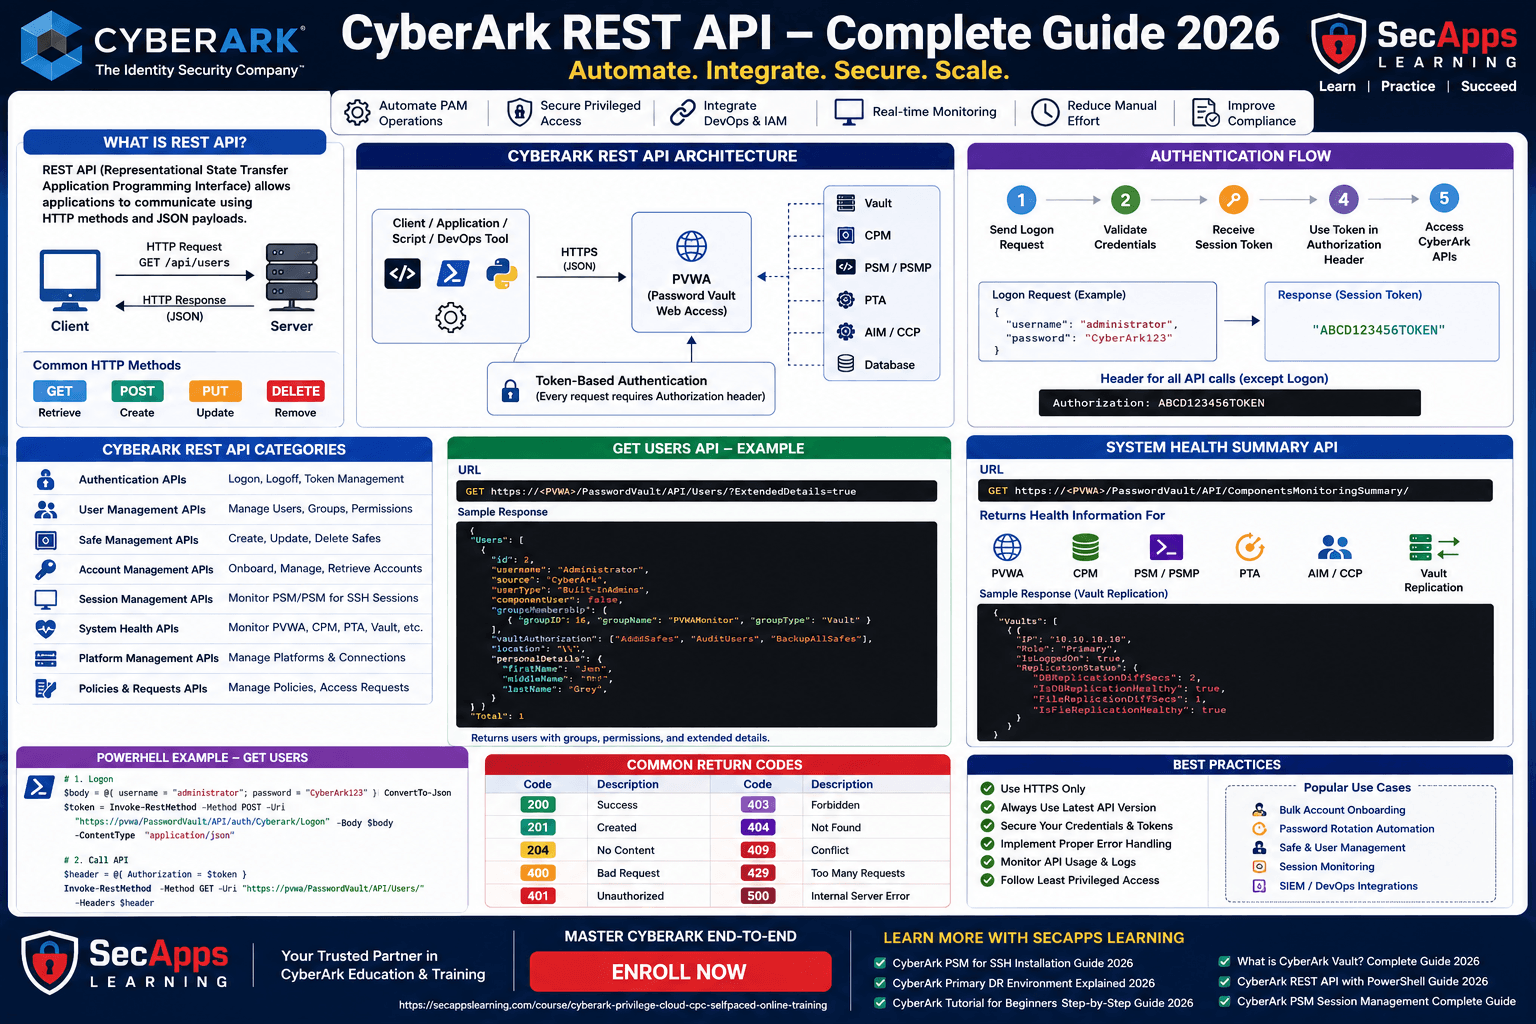
■ REST APIs
■ Automation
■ Troubleshooting
■ Production Scenarios
■ Real-Time Labs
■ Backup and Restore
■ Version Upgrade
■ LDAP Integration
■ SIEM Integration
■ Certificate Renewal
The CyberArk Vault is much more than just a password storage repository. It is a highly secure, enterprise-grade encrypted platform designed to protect privileged credentials and critical organizational secrets.
Understanding the internal architecture of:
■ PrivateArk Server
■ Logic Container
■ PrivateArk Client
■ Vault keys
■ Remote administration
■ Server configuration
■ Workspace functionality
■ Logging mechanisms
is essential for every CyberArk engineer.
Whether you are working on:
■ CyberArk implementation
■ Vault cluster setup
■ DR deployment
■ Production troubleshooting
■ Automation
■ REST API integration
■ Security operations
this foundational knowledge will significantly improve your troubleshooting and administration capabilities.
For more deep-dive CyberArk content, architecture guides, troubleshooting articles, and training resources, keep following SecApps Learning.
Your email address will not be published. Required fields are marked*
 July 20 2026
.png) July 17 2026
July 17 2026
 July 16 2026
 July 10 2026
 July 09 2026
 July 05 2026
 — Complete Vault, DR, Cluster & Distributed Upgrade Handbook-.png) July 03 2026
July 03 2026
 vs Central Credential Provider (CCP) Complete Guide to Installation, Architecture, Licensing, SDKs, ASCP & Best Practices (2026)-.png) July 01 2026
July 01 2026
.png) June 30 2026
June 30 2026
 June 25 2026
 June 24 2026
.png) June 10 2026
June 10 2026
 June 09 2026
 – Complete Architecture, Deployment, HA, DR & Best Practices Guide 2026.png) June 06 2026
June 06 2026
 Certification Guide 2026 by SL.png) June 04 2026
June 04 2026
 Complete Guide 2026 – Identity Protection, Identity Threat Detection, AI-Powered Security Monitoring, Response Playbooks, and ISI Migration.png) June 02 2026
June 02 2026
 May 30 2026
 Complete Guide – Architecture, Security, User Provisioning & Identity Governance.png) May 29 2026
May 29 2026
 Complete Guide – IdentityIQ, Identity Security Cloud (ISC), Certification, Architecture & Career Roadmap.png) May 27 2026
May 27 2026
 Complete Getting Started Guide – Architecture, Configuration & Real-World Implementation.png) May 26 2026
May 26 2026
 – Complete Comparison 2026.png) May 24 2026
May 22 2026
May 24 2026
May 22 2026
 May 21 2026
 vs Privileged Session Manager (PSM) Complete 2026 Guide.png) May 20 2026
May 20 2026
 May 19 2026
.png) May 18 2026
May 18 2026
.png) May 17 2026
May 17 2026
 The Complete Beginner to Advanced Guide to Ethical Hacking.png) May 15 2026
May 15 2026
 May 15 2026
 May 14 2026
 by SecApps Learning.png) May 14 2026
May 14 2026
 May 13 2026
 (1).png) May 12 2026
May 12 2026
.png) May 11 2026
May 11 2026
 May 10 2026
 May 10 2026
 May 08 2026
.png) May 07 2026
May 07 2026
.png) May 06 2026
May 06 2026
.png) May 06 2026
May 06 2026
 Complete Guide (2026).png) May 05 2026
May 05 2026
.png) May 05 2026
May 05 2026
 (1).png) May 04 2026
May 04 2026
.png) May 03 2026
May 03 2026
.png) May 01 2026
May 01 2026
.png) May 01 2026
May 01 2026
.png) April 30 2026
April 30 2026
.png) April 29 2026
April 29 2026
.png) April 28 2026
April 28 2026
.png) April 27 2026
April 27 2026
 System Health, Safe Management, Platform & Master Policy Explained.png) April 26 2026
April 26 2026
 April 20 2026
.png) April 19 2026
April 19 2026
.png) April 17 2026
April 17 2026
.png) April 16 2026
April 16 2026
.png) April 15 2026
April 15 2026
 April 14 2026
 April 10 2026
 April 09 2026
 April 08 2026
 April 07 2026
 July 31 2025
 May 01 2026
 December 26 2024
 December 15 2024
.jpeg) December 08 2024
December 08 2024
 May 01 2026
 October 29 2024
 October 19 2024
 October 15 2024
 October 07 2024
 September 30 2024
 September 23 2024
 September 16 2024
 May 04 2026
 August 27 2024
 August 27 2024
 August 21 2024
 August 19 2024
 May 01 2026
 May 10 2024
 May 08 2024
 May 01 2026
 April 30 2024
.jpg) April 29 2024
April 29 2024
 April 25 2024
 April 22 2024
 April 12 2024
 April 05 2024
 March 30 2024
 May 01 2026
 March 27 2024
 March 27 2024
 March 11 2024
 March 07 2024
 February 29 2024
.jpg) May 01 2026
May 01 2026
 January 24 2024
 January 20 2024
 January 20 2024
 January 20 2024
 January 20 2024
 January 03 2024
 January 03 2024
 January 03 2024
 January 03 2024
Copyright 2022 SecApps Learning. All Right Reserved
Comments ()